Auger Electron emission from Fixed-in-Space CO
|
We have ejected a Carbon 1s electron from CO by absorption of 305eV photons and investigated the subsequent Auger decay of the K-hole. The key questions addressed by this study are:
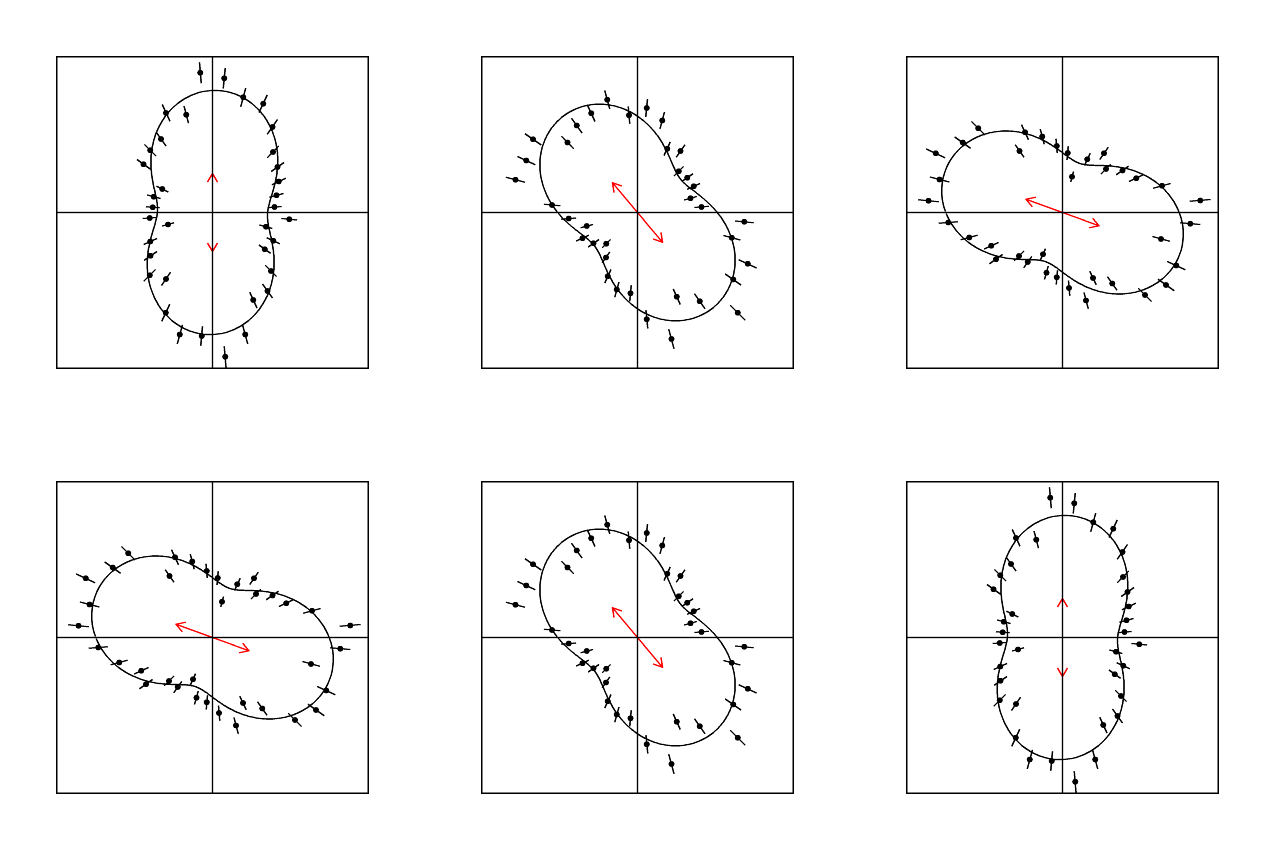
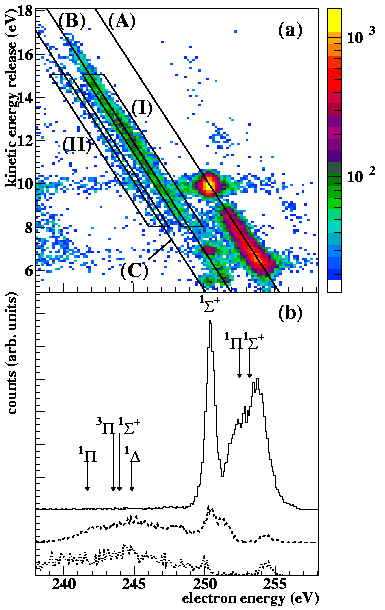
To answer these questions we have detected the Auger electron in coincidence with the charge state and momentum vector of the C+ and O+ fragments. The energy resolution for the Auger electrons is about 1 eV in the range investigated (see figure below). The experiment has been performed with linearly and circularly polarized photons. The linear polarization has been rotated from horizontal to vertical. The rotation has been monitored by the angular distribution of the C+ and O+ fragmentation axis for high kinetic energy release.  of Bl. 4 at the Advanced Light Source is rotated in steps of 10 deg.
From this we obtain a dataset which covers all direction of electron and molecular fragments with respect to the polarization axis. 
Auger decay of CO+ from 305 eV photon absorption
leading to C+ + O+. a) horizontal axis Auger electron
energy, vertical axis kinetic energy release. The diagonal lines
correspond to decays of the CO+ (C(1s)-1) ground state to
different final states of the ionic fragments: (A): C+(2P) + O+(4S) (ground state), (B):
C+(2P) + O+(2D), (C): C+(2P) + O+(2P). b) Auger electron spectra corresponding to (A) (B) and (C) final state (from top to
bottom). The arrows show the calculated mean energies for some
states. These calculated transitions have a width of 3-5 eV.
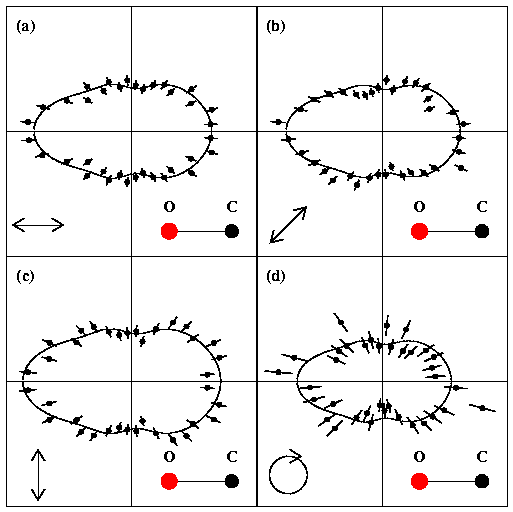
 Angular distribution of Auger electrons from the narrow
1Sigma+ line at 250.5 eV (B-state). The
orientation of the molecule is horizontal with the oxygen to the
left as indicated. a-c linear polarized light, the polarization
vector is indicated by the double arrow. (d) circular polarized
light, propagating into the plane of the figure. 
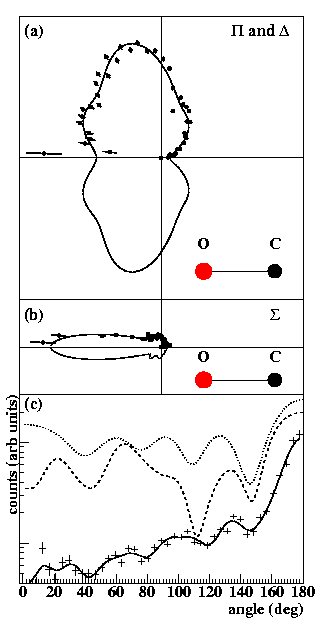
Angular distribution of Auger electrons from CO+.
(a) from region I Fig.1a, (b) region II Fig. 1a. (a) corresponds
to the $\rm CO+ (1Sigma+) -> CO2+ (1Delta, 3Pi,
1Pi) transition. b) corresponds to a CO+(1Sigma+)
-> CO2+(1Sigma) transition. c) same data as in b)
0 deg corresponds to emission in direction of the carbon. The full
lines in all figures are a fit of Legendre polynomials to guide
the eye. Other lines in c) are results of a multiple scattering
calculation for an S electron wave starting at the carbon center
in CO2+. Dashed: both vacancies in the CO2+ at
C(2p), dotted: one vacancy each at C(2p) and O(2p). The absolute
height of the calculation is arbitrary. |